


There has been a lot of discussion around sustainability in the coffee industry recently, from the war on waste campaign through to the specialty coffee reports on sustainability. However, what people mean when they talk about sustainability is often vague.
What do we mean by ‘Sustainability’?
To fully appreciate how to be more sustainable in our own industries, we need to understand what sustainability is. We (Seven Miles) define it to be the ability of any process or product to be maintained at a certain rate or level. To this end, we believe that for any business to be sustainable in the coffee industry, we need to focus on strengthening three pillars:
- Economic sustainability
- Environmental sustainability
- Social sustainability
Economic sustainability is perhaps the most obvious pillar. A business needs to be able to make a profit to stay afloat. However, when pursuing any initiative in areas of social or environmental change, this can sometimes fall by the wayside. Similarly, we don’t advocate pursuing profit at the expense of the other two pillars. We merely suggest that when evaluating whether you want to make a change to your business, keeping afloat financially is paramount to sustainably implementing this change! Environmental sustainability refers to being able to minimize (or if possible, eliminate) the footprint of your business on the environment. This is key to sustaining a business long-term, so that the coffee enjoyed by future generations is as good as, or better than the coffee we drink today. We have enough data to show that climate change is real, so doing what we can to minimize its impact on the continued productivity of coffee (our livelihoods!) should be at the core of what we do. Social sustainability is perhaps the least obvious pillar. It refers to being able to maintain healthy and livable communities. Attempting to achieve social sustainability requires thought both to your immediate social environment, as well as the broader impact of your business on worldwide society. One may view this as striking a healthy balance between providing positive café culture within your immediate environment (i.e. facilitating ‘fast coffee’ for customers who value speed more than a chat, or a more leisurely relaxing environment for people to connect outside of work), and the coffee community as a whole (i.e. supporting fairtrade practices by buying fairtrade/organic/rainforest alliance coffee).
The Barrier to Change
Regardless of social circumstances, there is one key barrier to implementing environmental change in any industry (including coffee): People! 90% of Australians support measures to fight climate change (see further reading link). However, individually, only one third of us are willing to pay (table below, modified from ABS data (see further reading). Admittedly, one data set was generated in 2008 and one in 2016, which means it’s likely the data has changed for 2018. However, if we assume that our willingness to pay has increased proportionally to our desire for a carbon tax (i.e. increased by about 10%), still less than half of us are willing to pay to reduce our carbon footprint.
| GreenPower Electricity | Australia Average |
| Willingness to Pay | 32.5% |
| Not Willing to Pay | 55.4% |
| Did not Know | 12.1% |
Is it Worth It?
So where do we go from here? We all seem aware that implementing environmental change costs money. But if no-one wants to pay for it, is there much point? If Shell is to be believed, there is. Shell is aiming to spend over 1 billion dollars (US) per year on renewable energy. They see their environmental resource as being finite based on social demand, so they are seeking ways of staying in business. Seemingly, Shell has the three-pillar model of sustainability well embedded into their business model.
How do we Identify where we can make the most difference?
So, how do we implement change successfully within our businesses? One of the most effective tools to target and then manage processes around sustainability is Life Cycle Assessment (LCA). LCA is best summarized as a ‘cradle to grave’ analysis. It takes all inputs and outputs from a process and ultimately computes the total footprint of that process. A visual interpretation of the concept is shown below. 
Applying LCA to Cafes – The CO2 Equivalent Footprint
For LCA to be of use, a common basis for comparing all processes and material/energy streams is essential. For this article, we used CO2e, or equivalent CO2 global warming footprint (measured as kg CO2). This number represents the global warming potential of a material or process. Most of the values we obtained to get the results shown in this article are those either computed directly or found from (see Further Reading). To perform an LCA around a café, we considered a number of feed streams and waste streams, as shown in the simplified diagram below. Some of these processes were found in the literature in their full ‘cradle to grave’ assessment, such as disposed cups, milk, roasted coffee and wastewater (there are several articles available on these subjects). Others required some assumptions and computation (e.g. food for cafes). Some required conversion factors, for example power (in NSW, Australia) has a CO2e factor of 0.87 compared to other states, as there is a significant contribution of hydroelectric power generated to the grid.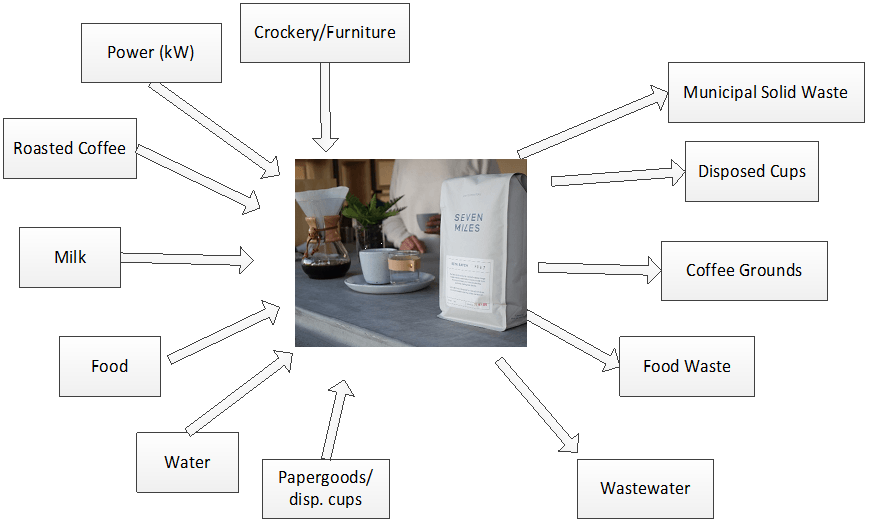 Once we converted all the streams above into CO2e, we summed them up and analysed their relative contribution to the total. The values below are based on a café using 100kg/week of roasted coffee.
In total, we found a 100kg/wk café produces about 6T of CO2e (per week). This is about the equivalent of 57 cars traveling their average distance/wk.The relative contribution of individual café material and energy streams is shown below.
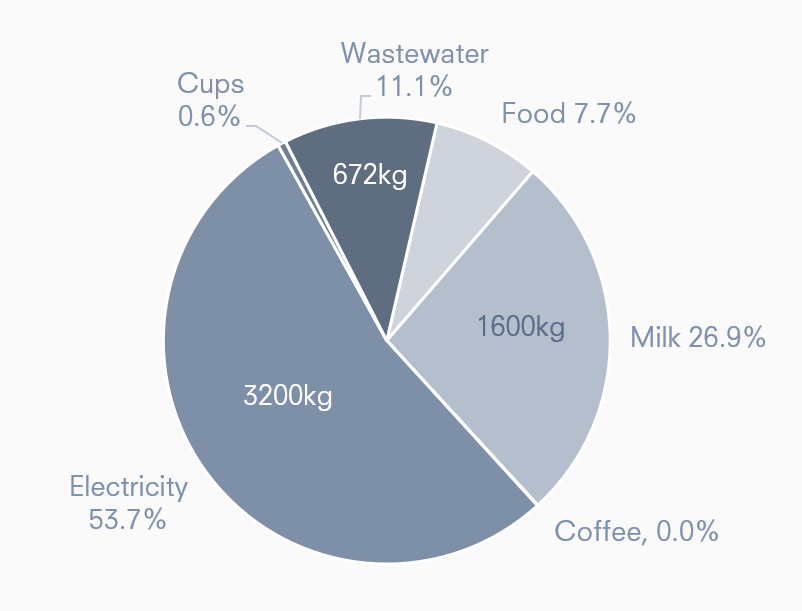
The major CO2e footprint components of a café are electricity, milk and wastewater. Together, these three inputs and waste streams makeup about 92% of the total CO2 footprint of a café.
If a café wants to target reducing their emissions, small changes to any one of these three areas will have a larger impact on their overall footprint, than large changes in any other category.
What about disposable cups?
What is perhaps most surprising above, is the relatively small footprint of disposable cups to the overall CO2e, particularly given all the press coverage relating to the topic. Even more surprising, we calculated the value of this stream as though all coffees served in a café were using disposable cups – so the value displayed above is likely much higher than is true in a typical café. There are three main reasons why we think this value is not as high as we typically accept it to be at face value. The first is that disposable cups weigh slightly less than a typical shot of espresso. There should be no surprise, then, that the CO2e footprint of cups is comparable in scale to the footprint of espresso (which it is, as shown in the pie chart above). Secondly, the primary raw material for paper cups are trees, which are in fact a CO2 absorber. We hazard to say that sustainable forestry, is in fact, one highly effective way of consuming CO2! So, that leaves only one aspect of the paper cup lifecycle that is negative in CO2e. The third reason for the low footprint is that disposable cups, once in landfill, if made with polyethylene, don’t significantly decompose over time, therefore having limited global warming potential. So, when you think about it, cups are a very small part of the overall environmental footprint of a café. That’s not to say they have no impact on the environment – we heartily endorse reducing carbon emissions of all forms! We just conclude here that there are also other, larger emitters worthy of attention.
Milk: the dark horse (dark cow?)
The footprint of milk was also a surprise to some at Seven Miles, though it didn’t take a lot of thinking to work out why. Milk is obtained from cows (usually…), and farming livestock has a heavy CO2e, primarily due to methane production and fertilizer usage. We also use a lot of milk in Australia for coffee. Over 85% of our market drinks milk with coffee, and typically in a café setting, we use about 220-250mL (about 230g) of milk per 21g of espresso. We go through a lot of milk! Interestingly, if a café in Australia were to reduce their milk consumption by 3%, the entire CO2e of disposable cups would be abated.
Energy: The easiest win?
One final point to make before moving on:
The largest CO2e footprint for Australian cafes, is energy usage.
Water has a very high heat capacity – that is, it takes a lot of electricity to heat a litre of water. Given the amount of water we use in a Cafe, how hot it needs to be, and that we use coal to generate the electricity needed to heat the water; it’s not surprising this has the largest footprint for cafes. We believe that there is some low hanging fruit in this area, where small changes can yield big economic and environmental rewards.
Now that we Know, Where do we Start?
We’ve identified the key areas around a café where we can target a reduction in CO2 footprint. Now how do we go about deciding how we reduce this footprint? We’ve come up with a modified risk assessment action plan heuristic that may help you decide. This hierarchy is shown below. It is divided into four main sections: Elimination, substitution, reduction and administrative control solutions. Elimination refers to completely removing an item or process from your café. Substitution looks at replacing an item with something similar that has a lower impact. Reduction looks at implementing solutions to reduce the overall usage of an item/process. Administrative control is looking at solutions that are outside your cafes immediate processes to other areas of the full life cycle. Ultimately, we believe that most solutions can be found by working your way down this solution hierarchy.
Let’s look at a few ways of applying the above in to any café:
Elimination
It is hard to eliminate anything entirely from a café, but meat may be a simple one for some cafes. Only offering food that is plant-based makes some sense. Eliminating a product entirely requires thought about the local clientele, and of course any action needs to be tested against the ‘three pillars’ of sustainability.
Substitution
Substitution is something that many cafes could consider. This could be in changing grid-based power to solar power, using easy-to-process cleaning products (i.e. environmentally sustainable soaps), and if possible, to source disposable cutlery/wastes that are recycled/recyclable.
Reduction
The easiest change here is to turn your machine off overnight. Studies at Seven Miles has shown that using a timer can save up $300 per quarter. Some machines have in-built timers, or ‘eco’-modes (often simply maintaining boilers at a lower temperature rather than switching them off), which automatically work to save power. In fact, there’s almost no reason not to do this for any café. It’s a win for all three pillars! Just be sure to properly heat up the machine pre-service. Other options include reducing milk usage in your cups, by either ordering smaller cups (having a greater coffee to milk ratio).
In fact, reducing milk usage by 3% completely offsets the entire carbon footprint of all paper cups used in a café!
Finally, you can reduce your reliance on takeaway cups. While a small contribution to overall CO2 emissions, it is still worth changing practices to minimize any and all disposable waste materials.
Administrative control
It may be the case that a café can’t implement any changes directly. In this case, we’ve suggested looking at ‘administrative control’ as a way of reducing their environmental footprint. This refers to looking outside your cafes immediate energy usage and find ways or lowering the footprint indirectly. Think of it like a carbon credit system. For example, one may consider moving some profits from the café into environmental initiatives, such as sustainable and ethical coffee sourcing (rainforest alliance, Fairtrade/Organic and other initiatives). This can significantly abate carbon emissions by increasing the productivity of the supply side. In fact,
one hectare of 3-year-old coffee plants completely absorbs 100% of the carbon emissions of a 100kg/week café.
Final Thoughts We strongly believe in building a sustainable coffee community. We want coffee to be enjoyed for all future generations. To do this we need to be investing in sustainable initiatives now, large or small. If you have any new ideas, thoughts, or ways of doing things, we’d love to hear them! Please get in contact and we can discuss how to make your ideas a reality!
References and Further Reading Academic Journal Papers
- Roberta Salomone, Food Agriculture & Environment 1 (2): 295-300, 2003
- Bragantia 70 no.4 Campinas - Coffee crop coefficient for precision irrigation based on leaf area index: A.R. Pereira et al. - 2011
- The Journal of Coffee Research 5(1/2), 7-20 – Crop Physiological Aspects of Coffee Bean Yield: A Review, M.G.R. Cannell - 1975
- ABS, 2008: No. 4602.0.55.001
- Shell increasing spending on clean energy spending, accessed in April 2018
- Carbon footprint of bananas, accessed March 2018
- Wastewater treatment and full-footpring analysis, a public release by Sydney Water, accessed March 2018
- Carbon footprint of butter, Accessed February 2018
- Meat CO2 emissions
- https://www.ecowatch.com/coffees-invisible-carbon-footprint-1882175408.html” Accessed March 2018
- Calculating greenhouse gas emissions for electricity generated in Australia, by State, accessed February 2018
- Carbon Clear public release on sustainability of disposable cups vs. non-disposable cups, Accessed January 2018
- Carbon footprint of wastewater and water supply by Sydney Water, Accessed February 2018
- Australians supporting climate change action by government